
Does producing more fat really pay off? The numbers tell a different story. Fat is the milk component that requires the highest amount of energy to produce. At the same time, it is the component that the market rewards the least. Every extra kilogram of fat has a cost, both for the farmer and for the cow, without providing a proportional economic return.
Producing More Fat Does Not Pay Off. The Data Proves It.
There is one question every dairy farmer should ask at least once: when a cow produces 0.1% more fat, how much extra does the farmer actually receive? And how much is an extra 0.1% of protein worth? The answer can be found in the milk quality payment system (PLQ in Italy), and it leaves no room for doubt. Now, in Italy, an increase of 0.1% in milk fat is rewarded with €0.207 per 100 litres of milk. An increase of 0.1% in milk protein is rewarded with €0.465 per 100 litres of milk. This means that protein is paid 2.25 times more than fat (Source: CLAL, average Milk Quality Payment parameters, Lombardy – Northern Italy).
The market has already made its choice, and it has done so very clearly. The reason is simple: most of the milk fat is used to produce butter and cream, products with a relatively low market value and prices that can change significantly. Protein, on the other hand, is the key component in cheese production. Casein forms the structure of the cheese, determines the cheese yield, and makes cheeses such as Parmigiano Reggiano and Grana Padano possible. More protein means more cheese from the same litre of milk. Yet, despite what the payment system clearly shows, dairy cattle genetics—especially those developed in North America—continue to move in the opposite direction.
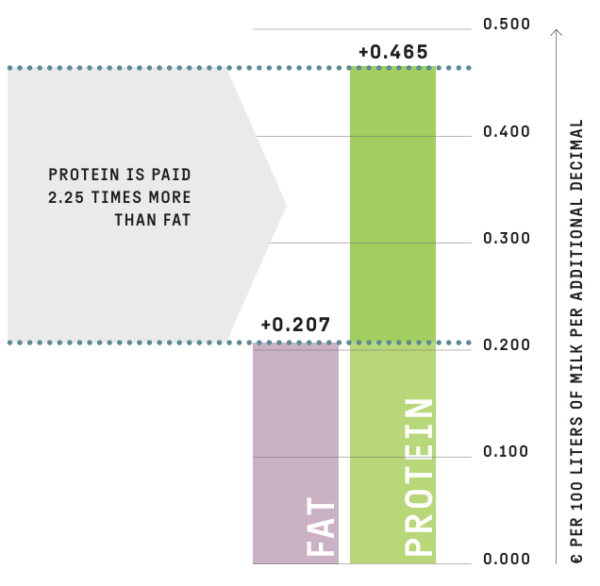
EUROS PER ADDITIONAL DECIMAL POINT OF FAT AND PROTEIN
Source: CLAL - milk quality payment parameters
The Hidden Energy Cost of Milk Fat
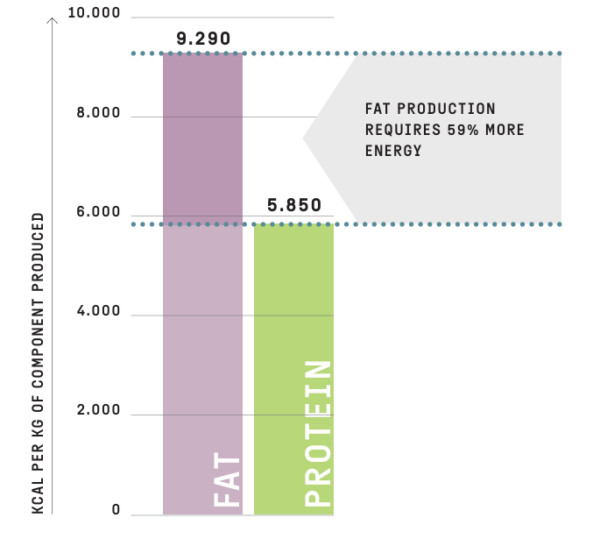
NET ENERGY REQUIREMENT FOR THE PRODUCTION OF 1 KG OF FAT VS. 1 KG OF PROTEIN IN MILK
Source: NRC - Nutrient Requirements of Dairy Cattle, 8th ed. (2021)
There is another disadvantage, less visible but just as important: producing milk fat requires much more energy than producing milk protein. The data comes from the latest edition of the Nutrient Requirements of Dairy Cattle, published by the National Research Council (NRC, 2021), the world’s leading scientific reference for dairy cattle nutrition. The equation used to calculate the net energy required for milk production is clear: every kilogram of milk fat requires 9,290 kcal of net energy for lactation (NEL). Every kilogram of milk protein
requires 5,850 kcal of NEL. This is a 59% higher energy requirement for fat compared with protein.
This imbalance has direct practical consequences for farm management. A cow genetically selected for higher milk fat production requires a more energy-dense diet to express her full potential: more concentrates, less fibre, and a higher cost per kilogram of dry matter intake.
This is a cost that the farmer pays every day, for every cow, without a proportional return in the milk price.
As effectively summarised by a 2024 study published in the scientific journal Animals (Guo et al.): “The energy required for fat production is the highest among all milk components.” In other words, the cow uses a significant amount of energy to produce something that has a relatively low economic value.
The Global Situation: Is Genetics Moving in the Wrong Direction?
If milk payment systems and energy costs clearly show that, at least in the Italian context, the right path is to select for higher protein content — unlike markets such as North America, where fat has a greater economic value — a natural question arises: Is global dairy genetics moving in this direction? Unfortunately, the answer is no.
Data from the Council on Dairy Cattle Breeding (CDCB) clearly show the problem. The ratio between protein and fat in the phenotypic production of American Holsteins remained substantially stable, around 0.83–0.84, for almost twenty years. Then, starting in 2019, a decline began that has not yet stopped: in 2024, the ratio reached 0.77, the lowest value ever recorded. For every 100 kg of fat produced, American cows today produce 6 kg less protein than they did just six years ago. This trend is not limited to the United States. In Italy too, ANAFIBJ data from 2026 show a declining protein-to-fat ratio in functional milk recordings. This is not a coincidence: widely used imported bulls bring with them the genetic pressure towards higher fat production that characterises Anglo-Saxon selection systems.
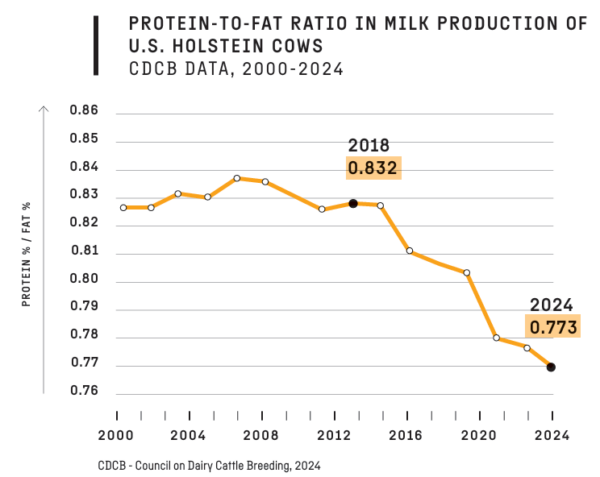
PROTEIN-TO-FAT RATIO IN MILK PRODUCTION OF U.S. HOLSTEIN COWS
CDCB DATA, 2000-2024
Intermizoo and Pro Caseus+: A Selection Looking to the Future
For the Italian PDO dairy economy, however, farmers’ needs seem to be moving in a different direction: those supplying milk for Grana Padano, Parmigiano Reggiano, or other protected designation cheeses need more protein, not more fat. This is the context in which Intermizoo’s selection approach is positioned.
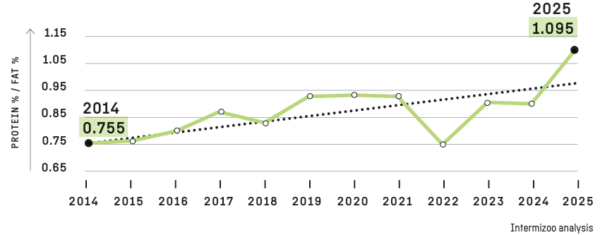
PROTEIN-TO-FAT RATIO IN THE INDEXES OF INTERMIZOO BULLS
ANAFIBJ DATA, 2014-2025
By analysing the Intermizoo bull portfolio, taking into account the annual genetic base adjustment carried out by ANAFIBJ, a clear trend emerges: the ratio between kilograms of protein and kilograms of fat in genetic values has increased steadily from 2014 to today. In the first period analysed (2014–2018), the median ratio was 0.789. From 2020 onwards, it reached 0.895, representing a 13.4% increase. In 2025, for the first time, kilograms of protein exceeded kilograms of fat: on average, Intermizoo bulls transmit the ability to produce more
protein than fat. This is neither a coincidence nor a statistical effect. It is the result of a deliberate selection strategy, built over time through an approach that places milk quality at the centre of breeding value evaluation.
In this journey, one tool has played a fundamental role: Pro Caseus+, the genomic index for cheese-making aptitude developed by Intermizoo and patented in 2021. Pro Caseus+ evaluates the genetic predisposition of each individual animal to produce milk with better coagulation characteristics, protein composition, and cheese-making yield. It is expressed on an easy-to-understand scale (base 100, standard deviation 5), can be applied to a biological sample from any animal, and works on two complementary fronts: the selection of bulls to be used for breeding and the evaluation of cows already present in the herd. When genetics is directed in the right way, the results can be seen in the numbers. Selecting for protein today means protecting farmers’ profitability tomorrow.